
In this post, we explore the pros and cons of using technical analysis indicators on closed candles versus live candles. We discuss the impact on false signals, reliability, timeliness, and market conditions, and provide examples of different types of indicators. Read on to learn how to choose the best approach for your specific trading strategy.
Technical analysis indicators can be a useful tool for traders to identify trends, identify potential buying and selling opportunities, and make informed trading decisions. However, the choice between using these indicators on closed candles or live candles can have a significant impact on the signals that are generated and the reliability of those signals. In this post, we will explore the benefits and disadvantages of using technical analysis indicators on closed candles versus live candles, and discuss how traders can choose the best approach for their specific goals and risk tolerance.
Benefits of using technical analysis indicators on closed candles
- Fewer signals are generated, which can help to reduce the risk of false signals and increase the reliability of the signals that are generated.
- Example: Using a moving average (MA) crossover on closed candles. A trader is using a 20-period MA and a 50-period MA on a daily chart to identify trend changes and generate buy and sell signals. If the 20-period MA crosses above the 50-period MA on a closed candle, the trader may interpret this as a buy signal, as it suggests that the short-term trend is becoming more bullish. On the other hand, if the 20-period MA crosses below the 50-period MA on a closed candle, the trader may interpret this as a sell signal, as it suggests that the short-term trend is becoming more bearish.
- Example: Using a moving average (MA) crossover on closed candles. A trader is using a 20-period MA and a 50-period MA on a daily chart to identify trend changes and generate buy and sell signals. If the 20-period MA crosses above the 50-period MA on a closed candle, the trader may interpret this as a buy signal, as it suggests that the short-term trend is becoming more bullish. On the other hand, if the 20-period MA crosses below the 50-period MA on a closed candle, the trader may interpret this as a sell signal, as it suggests that the short-term trend is becoming more bearish.
- The signals may be more representative of the underlying trend or market conditions, as they are based on the closing prices of the candles rather than the most recent price action.
- Example: Using an oscillator, such as the relative strength index (RSI), on closed candles. A trader is using the RSI on a daily chart to identify overbought and oversold conditions in the market and generate buy and sell signals. If the RSI rises above 70 on a closed candle, the trader may interpret this as a sell signal, as it suggests that the security is overbought and may be due for a correction. On the other hand, if the RSI falls below 30 on a closed candle, the trader may interpret this as a buy signal, as it suggests that the security is oversold and may be undervalued.
Disadvantages of using technical analysis indicators on closed candles
- The signals may be less timely, as they are based on the closing prices of the candles rather than the most recent price action.
- The signals may not accurately reflect the current market conditions, as the indicator values are based on past price action.
Benefits of using technical analysis indicators on live candles
- The signals are based on the most recent price action, which can make them more timely and relevant to the current market conditions.
- Example: Using a moving average (MA) crossover on live candles. A trader is using a 20-period MA and a 50-period MA on a 5-minute chart to identify trend changes and generate buy and sell signals. If the 20-period MA crosses above the 50-period MA on a live candle, the trader may interpret this as a buy signal, as it suggests that the short-term trend is becoming more bullish. On the other hand, if the 20-period MA crosses below the 50-period MA on a live candle, the trader may interpret this as a sell signal, as it suggests that the short-term trend is becoming more bearish.
- The signals may be more responsive to short-term price movements, which can be useful in markets that are highly volatile or trendless.
- Example: Using an oscillator, such as the relative strength index (RSI), on live candles. A trader is using the RSI on a 5-minute chart to identify overbought and oversold conditions in the market and generate buy and sell signals. If the RSI rises above 70 on a live candle, the trader may interpret this as a sell signal, as it suggests that the security is overbought and may be due for a correction. On the other hand, if the RSI falls below 30 on a live candle, the trader may interpret this as a buy signal, as it suggests that the security is oversold and may be undervalued.
Disadvantages of using technical analysis indicators on live candles
- More signals may be generated, which can increase the risk of false signals and decrease the reliability of the signals that are generated.
- The signals may be more sensitive to short-term price movements, which can make them less reliable in markets that are choppy or trendless.
It is important to note that the examples above, and the specific signals and interpretation of the signals will depend on the trader’s individual goals and risk tolerance, as well as the specific characteristics of the market being traded.
Conclusion
Using technical analysis indicators on closed candles versus live candles can have different benefits and disadvantages depending on the specific indicator and the trader’s goals and risk tolerance. Traders should carefully consider these factors when choosing which approach to use, and may want to test both approaches to see which one works best for their specific trading strategy. It may also be helpful to use a combination of different indicators and analysis techniques in order to increase the reliability of the signals and reduce the risk of false signals.
Connected Discoveries
Unraveling Ideas That Inspire.
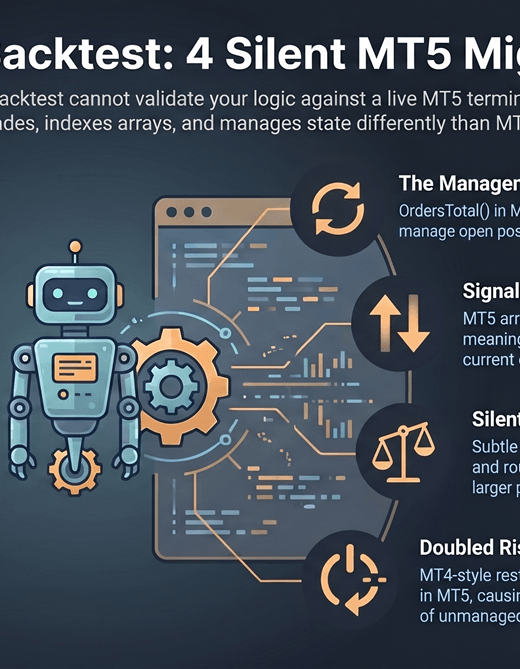
MT4 to MT5 Migration: Four Failures That Pass the Backtest
Part 1 covered the three MT4-to-MT5 failures that show up the instant…
Continue Reading MT4 to MT5 Migration: Four Failures That Pass the Backtest
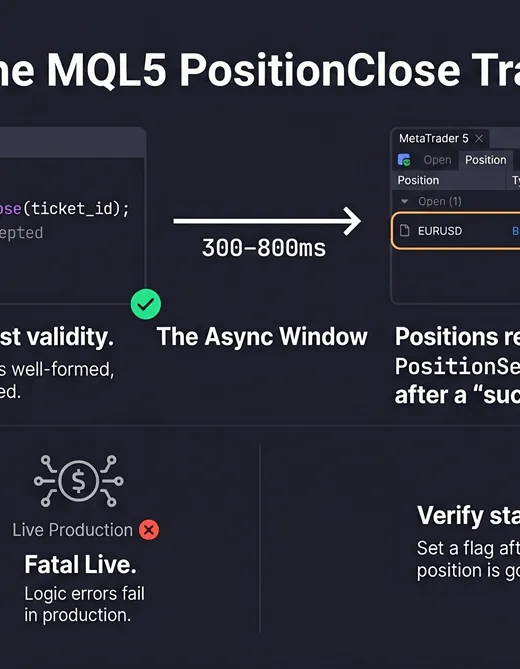
CTrade PositionClose: What the MQL5 Docs Don’t Cover
The MQL5 reference page for `PositionClose()` is accurate. It documents the signature,…
Continue Reading CTrade PositionClose: What the MQL5 Docs Don’t Cover

What We Do in the First Two Days of Your EA Project (It’s Not Writing Code)
The brief said “medium complexity, standard EA.” The first requirements session surfaced…
Continue Reading What We Do in the First Two Days of Your EA Project (It’s Not Writing Code)
Leave a Reply